Campus Climate Survey
In the Spring 2019 semester, Missouri State University administered the 39-question Higher Education Data Sharing (HEDS) Climate Survey. This survey was administered to students, faculty, staff, and administrators.
View Climate survey results presentation
Executive Summary 2019 Climate Survey
This is a guide to the 39-question Higher Education Data Sharing (HEDS) Campus Climate Survey administered in spring 2019 to students, faculty, staff, and administrators. Missouri State’s results are compared to a group of 52 large and small institutions of higher education (n=36,194).
The 2,723 individuals who responded to the survey make up 9% of undergraduates, 18% of graduate students, 40% of faculty, and 37% of staff and administrators on the Springfield campus.
|
Respondent Group |
Number (n) |
|---|---|
|
Undergraduates |
1,321 |
|
Graduate |
264 |
|
Faculty |
434 |
|
Staff/Administrators |
704 |
Overall Diversity and Equity: Above Comparison Institutions
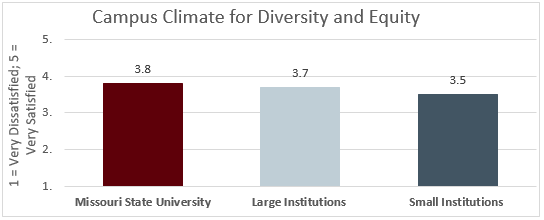
The first two indicators gauge the respondents' satisfaction with the campus climate for diversity and equity (Table 1) and the extent to which they believe that Missouri State University supports diversity and equity (Figures 1 and 2). Because these two indicators measure experiences and interactions that promote campus climate, we show each of these as positive scores on a 5-point scale in the graphs below.
Missouri State respondents reported higher satisfaction on questions related to overall campus climate for diversity and equity (Table 1) than large and small comparison institutions (Figure 1).
Figure 1. Higher Satisfaction on Campus Climate
|
Overall campus climate |
Sense of belonging or community at MSU |
Feel campus environment is free from tensions related to individual or group differences |
Feel retention of historically marginalized students, faculty, and staff is an institutional priority |
|---|---|---|---|
|
Campus experience/environment regarding diversity at MSU |
Feel all community members experience a sense of belonging or community |
Feel recruitment of historically marginalized students, faculty, and staff is an institutional priority |
Feel senior leadership demonstrates a commitment to diversity and equity on this campus |
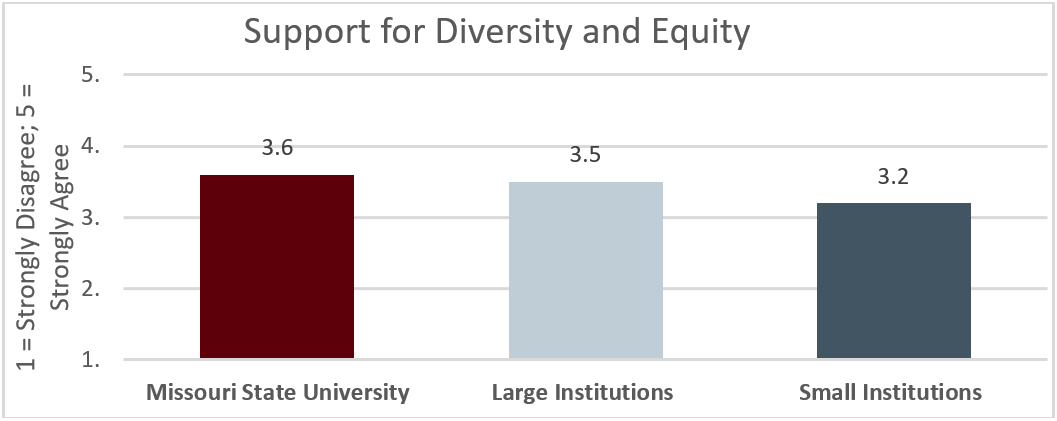
Missouri State respondents reported higher agreement on their belief that Missouri State supports diversity and equity compared to large and small institutions (Figure 2).
Figure 2. Missouri State More Strongly Agrees that the University Supports Diversity and Equity
Overall diversity and equity at Missouri State shows higher positive perceptions than comparison institutions. Within Missouri State, some demographic groups have less positive views and perceptions of campus and institutional support. Those groups are non-binary individuals, U.S. persons of color, LGB+ individuals, and liberal individuals (Table 2 and 3).
|
Race and/or Ethnicity and Role |
MSU (n) |
MSU Mean |
Large Institutions Mean |
Small Institutions Mean |
|
|---|---|---|---|---|---|
|
All Students |
U.S. White |
1,080 |
3.90 |
3.81 |
3.59 |
|
U.S. Persons of Color |
336 |
3.44 |
3.70 |
3.27 |
|
|
International |
140 |
4.04 |
3.94 |
3.43 |
|
|
All Employees |
U.S. White |
897 |
3.87 |
3.64 |
3.60 |
|
U.S. Persons of Color |
187 |
3.61 |
3.48 |
3.37 |
|
|
International |
16 |
3.84 |
4.16 |
3.53 |
|
|
Role and Gender and Role |
MSU (n) |
MSU Mean |
Large Institutions Mean |
Small Institutions Mean |
|
|---|---|---|---|---|---|
|
All Students |
Men |
481 |
3.83 |
3.83 |
3.56 |
|
Women |
1,045 |
3.83 |
3.74 |
3.46 |
|
|
Non-binary |
37 |
3.36 |
3.47 |
3.09 |
|
|
All Employees |
Men |
429 |
3.80 |
3.69 |
3.65 |
|
Women |
673 |
3.86 |
3.54 |
3.50 |
|
|
Non-binary |
8 |
2.22 |
3.00 |
3.01 |
|
|
Role and Sexual Orientation |
MSU (n) |
MSU Mean |
Large Institutions Mean |
Small Institutions Mean |
|
|---|---|---|---|---|---|
|
All Students |
Heterosexual |
1,219 |
3.88 |
3.80 |
3.57 |
|
LGB+ |
333 |
3.59 |
3.63 |
3.25 |
|
|
All Employees |
Heterosexual |
968 |
3.86 |
3.62 |
3.59 |
|
LGB+ |
136 |
3.51 |
3.41 |
3.34 |
|
- People who took the survey reported that Diversity and Equity activities increased positive attitudes toward diversity and equity. Missouri State participation is higher than comparison groups; attitudes reported are more positive for all groups.
- Staff/administration reported participating more in “impactful diversity and equity activities” (community service, performances or art exhibits related to diversity, discussions, training, activities) than large and small comparison institutions.
- Undergraduate and Graduate students reported more community service participation than other groups at MSU and compared to large and small institutions.
Views of Campus Climate by Groups
- When analyzed by race/ethnicity, U.S. white students, men and women, international individuals, heterosexual individuals, and conservative individuals have more positive views of campus climate (Table 2 and 3).
- Non-binary individuals, U.S. persons of color, LGB+ individuals, and liberal individuals have less positive views of campus climate (Table 2 and 3).
- Table 2 and Table 3 report broad groups: race/ethnicity and sexual orientation. The survey includes 16 options for race/ethnicity and 8 options for sexual orientation (data tables are available for breakdowns).
"Have You Been Discriminated Against or Harassed?”
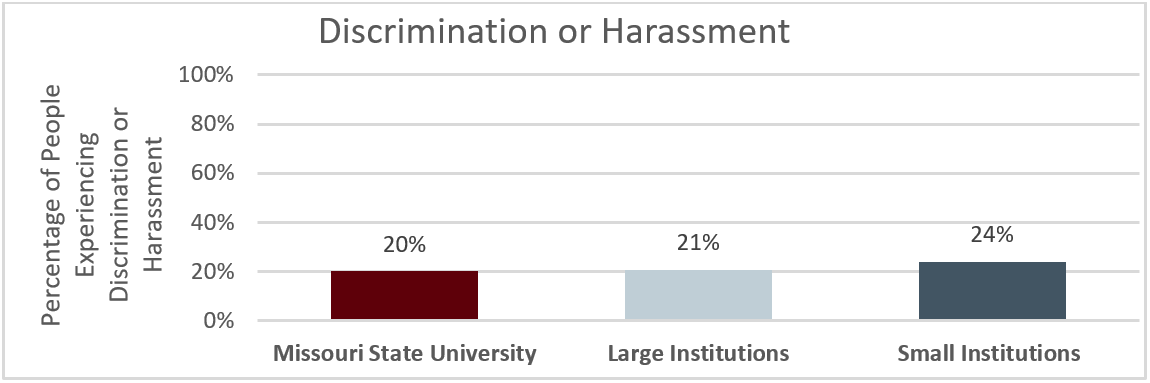
- People at Missouri State reported experiencing less discrimination or harassment than large and small institutions (Figure 3).
- 20% of Missouri State students and employees reported having experienced discrimination or harassment. Large institutions reported 21% and small institutions reported 24% (Figure 3).
- 317 out of 1,578 Students answered “yes” to the question.
- 228 out of 1,129 Employees answered “yes.”
Figure 3. Percent Experiencing Discrimination or Harassment
“How often have you been discriminated or harassed and what were the reasons?”
- Of the 545 who answered “yes,” they then answered a follow-up question asking how often discrimination and harassment occurred and the reason.
- The reasons—whether they reported Rarely, Sometimes, Often, or Very Often, are as follows beginning with the highest count: political affiliation, physical appearance, gender or gender identity, age or generation, religious background, racial and/or ethnic identity, socioeconomic background, sexual orientation, some other aspect of my identity, disability, or immigration status (Table 4).
|
Reason For Discrimination |
Rarely |
Sometimes |
Often |
Very Often |
Totals |
||||
|---|---|---|---|---|---|---|---|---|---|
|
S |
E |
S |
E |
S |
E |
S |
E |
||
|
Political affiliation/views |
41 |
40 |
77 |
57 |
36 |
21 |
31 |
15 |
318 |
|
Physical appearance |
60 |
33 |
75 |
60 |
34 |
9 |
24 |
12 |
307 |
|
Gender or gender identity |
49 |
23 |
59 |
62 |
46 |
19 |
22 |
16 |
296 |
|
Age or generation |
58 |
35 |
53 |
67 |
17 |
25 |
20 |
9 |
284 |
|
Religious background |
48 |
41 |
50 |
36 |
25 |
10 |
14 |
11 |
235 |
|
Racial and/or ethnic identity |
23 |
18 |
59 |
32 |
34 |
9 |
27 |
16 |
218 |
|
Socioeconomic background |
45 |
37 |
43 |
25 |
11 |
10 |
9 |
5 |
185 |
|
Sexual Orientation |
31 |
16 |
47 |
20 |
19 |
8 |
15 |
3 |
159 |
|
Some other aspect of my identity |
14 |
11 |
11 |
22 |
9 |
11 |
9 |
10 |
97 |
|
Disability |
23 |
13 |
19 |
16 |
6 |
3 |
7 |
5 |
92 |
|
I am an immigrant |
15 |
4 |
16 |
9 |
6 |
3 |
5 |
6 |
64 |
Key: S=Students; E=Employees
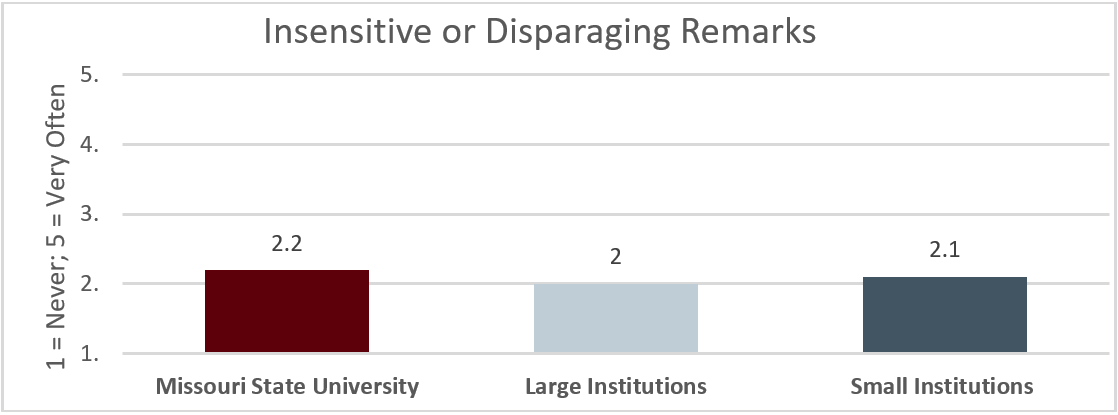
“How Often Have You Heard Someone Make an Insensitive or Disparaging Remark?”
- Missouri State students and employees heard slightly more (2.2) insensitive or disparaging remarks than small and large institutions, on a scale of 1-5 with 1 being Never and 5 being Very Often (Figure 4).
- Missouri State students and employees heard the insensitive or disparaging remarks in the local community more than comparison institutions. Missouri State was 33% compared to 7% of respondents at Large and Small institutions.
- A follow-up item asked the reason for the top items by count—whether they reported Rarely, Sometimes, Often, or Very Often, are as follows beginning with the highest count: political affiliation/views, gender or gender identity, religious background, sexual orientation, age or generation, racial and/or ethnic identity, non-native English speaker, immigrant status, socioeconomic background, disability (Table 5).
Figure 4. Hearing Insensitive or Disparaging Remarks
|
Target of Disparaging Remark |
Rarely |
Sometimes |
Often |
Very Often |
Totals |
||||
|---|---|---|---|---|---|---|---|---|---|
|
S |
E |
S |
E |
S |
E |
S |
E |
||
|
Political affiliation/views |
331 |
251 |
417 |
361 |
323 |
212 |
199 |
107 |
2,201 |
|
Religious background |
445 |
381 |
411 |
279 |
157 |
69 |
56 |
27 |
1,825 |
|
Gender or gender identity |
387 |
365 |
409 |
260 |
188 |
82 |
89 |
27 |
1,807 |
|
Sexual Orientation |
431 |
378 |
400 |
247 |
163 |
63 |
77 |
24 |
1,783 |
|
Racial and/or ethnic identity |
459 |
371 |
382 |
242 |
136 |
61 |
76 |
27 |
1,754 |
|
Age or generation |
441 |
354 |
338 |
281 |
144 |
88 |
65 |
42 |
1,753 |
|
Non-native English speaker |
459 |
356 |
372 |
260 |
116 |
83 |
48 |
28 |
1,722 |
|
Immigrant Status |
435 |
326 |
343 |
222 |
134 |
56 |
50 |
27 |
1,593 |
|
Socioeconomic background |
494 |
381 |
292 |
190 |
96 |
54 |
51 |
19 |
1,577 |
|
Disability |
462 |
344 |
236 |
156 |
71 |
29 |
33 |
12 |
1,343 |
Key: S=Students; E=Employees